Categories
New

Things 109: Jonathan’s Card, Dr Who Cats, Mix Shift Visualisation

Question – Nothing to Hide
As technology makes surveillance of many kinds ever easier, some people  are worried about Big Brother, two words which conveniently encompass the general idea that this would be bad, via Orwell’s 1984, which incidentally is one of those classics that you really should read if you haven’t yet as it is only becoming more relevant.

In response to this, others say “If you have nothing to hide, then you have nothing to fear,” which is powerfully concise rebuttal to these vague fears.

I can think of some counterarguments to that, but they tend to be long, and as noted by The Brads, something that takes more than 140 characters to explain doesn’t generally spread. So: this week’s challenge is to come up with a counterargument for “nothing to hide” that is 140 characters long or fewer.

Link
A while ago, as an experiment, Jonathan Stark made his Starbucks card details public, so anyone could add credit and anyone could spend that credit. His page explaining this is here. (Note the caveat at the top – this no longer works).

Sam Odio found an easy way to transfer credit to his own Starbucks card, and I recommend reading his take on the idea (and his exploit) here.

If you don’t have time for that, you could just read this summary of the whole story over at Good, which lays out the whole strange tale.

Quote
Les Dawson:

“There is a remote tribe that worships the number zero. Is nothing sacred?”

Picture (via Jason)
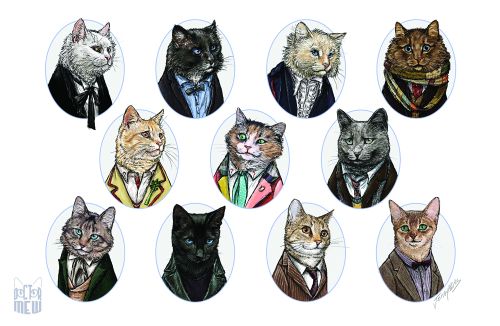
Pure internet linkbait, but with an execution this good, it deserves to be: Dr Who cats.

Previous Puzzle
Last time I asked for ways to visualise data in such a way that mix shifts affecting conversion rate would be readily apparent.

Adam naturally had a full consultant’s answer, explaining how he would show the data different ways depending on the audience (sales director, website content manager, SEO manager…), and how he might talk through the component parts of the change in a sequence of slides, which is all very sensible. However, what I really want is something that I as an analyst can look at to apprehend the whole situation, ideally in a generic way, so any given shift becomes clear.

Simon described an interesting single-view answer, but in preparing this post I realised I needed to confirm some of its details with him, so that will have to wait for a later edition of Things.

On to my answer… the data set was as follows:

[before mix shift | after mix shift]:

Banjo section visits [10,000 | 20,000] – lots more traffic
Banjo section sales [100 | 220]
Banjo section conversion [1.0% | 1.1%] – conversion increases!

Gun section visits [1,000 | 1,000] – same traffic as ever
Gun section sales [100 | 110]
Gun section conversion [10% | 11%] – conversion increases!

Overall conversion before:
(100 + 100) / (10,000 + 1,000) = 1.82%
Overall conversion after:
(220 + 110) / (20,000 + 1,000) = 1.57% – overall conversion has decreased!

My solution looks like this:

This shows how the total visits and orders (black lines) are composed of the individual sections (red/gun and blue/banjo). While both the blue and red arrows get steeper (representing improved conversion, although it’s hard to see this on the red arrow), the angle of the black line decreases (representing the overall decrease in conversion), since the blue arrow became so much longer.

This pretty much works for the extreme example given. However, it has significant weaknesses as a general solution:

  • It doesn’t work as a trended view – conceivably it could be animated, but that seems like overkill
  • It’s hard to compare the angle of arrows when traffic changes significantly, as in the gun section above
  • It tends to encode all the interesting information into a narrow diagonal band of the chart.

Further improvements are of course welcome!

-Transmission Ends

Categories
New

Things 108: Mix Shifts, Skrekkogle, 109 Children vs Real Madrid

Previous Puzzle: Guns & Banjos
Previously in Things I asked how a banjo and gun website could see conversion in its individual sections improving, but overall conversion decline. Xuan pointed out that visits to some part of the site not counted in either section could see an increase in non-converting visits and so drive the effect, but this is a loophole – even without such a section, the problem can still arise.

The answer here lies in the part of the data not revealed in the setting: the underlying traffic trends. In particular, if you have one particular section (or segment) that converts at a low rate, and the mix of your traffic shifts towards that group, then that will tend to pull down the overall average conversion, even if conversion within the groups is going up.

To take a simple example, consider the following figures for this theoretical guns and banjos site, with figures in the form [before mix shift | after mix shift]:

Banjo section visits [10,000 | 20,000] – lots more traffic
Banjo section sales [100 | 220]
Banjo section conversion [1.0% | 1.1%] – conversion increases!

Gun section visits [1,000 | 1,000] – same traffic as ever
Gun section sales [100 | 110]
Gun section conversion [10% | 11%] – conversion increases!

Overall conversion before:
(100 + 100) / (10,000 + 1,000) = 1.82%
Overall conversion after:
(220 + 110) / (20,000 + 1,000) = 1.57% – overall conversion has decreased!

In practice you will rarely see an effect this strong. On the other hand, you could well see mix shifts drive a significant part of an overall shift in conversion rate. So watch out for that.

Puzzle: Mix Shift Visualisation
This is a really tough one, but I know the Things recipients are up to the task.

Given that mix shifts as described above can be difficult to spot, how might you visualise your website’s data in such a way that any such effects became obvious?

(I have an answer for this, but I feel sure a better answer must exist).

Quote
Everyone seems to be linking to this surprisingly weakly curated collection of Steve Jobs quotes. One part that I did like expressed something I’ve been thinking for a while:

Steve Jobs: I have a very optimistic view of individuals. As individuals, people are inherently good. I have a somewhat more pessimistic view of people in groups.

Or as I’ve tried to distill it: humans don’t scale.

Link
These guys make cool stuff, even if their website is slightly too clever for its own good.

Video
It’s too easy for imagination to be constrained by what we already know exists. That’s why I like things like this video, which help remind us that many more things are possible. It’s not particularly well edited and there are no particular highlights, so feel free to skip through and enjoy the general sensation of weirdness, which is after all what we generally look for on the internet, and indeed in life. Or maybe that’s just me.

Categories
New

Things 107: Transmedia Hardware, Rorschmap, Cyborgs vs Robots

Puzzle
Here’s a cute data analysis puzzle, which I’m amazed I didn’t encounter sooner in my line of work.

You run a website that sells guns and banjos, and one day you notice from your web analytics data that the conversion rate of your site (orders divided by visits) is steadily declining over time.

Realising that you essentially cater to two quite different needs, you look at the performance of your two main site sections: the gun section and the banjo section. There is no significant overlap between the people visiting these sections.

Here’s the problem. The conversion rates in both the gun and banjo sections of the site are going up over the same period that overall conversion is going down. How is this possible?


Video
Some serious puppetry:

http://www.youtube.com/watch?v=HFf3ZWNF6EY

Link
Charlie Gower realised he could get old iPod shuffles cheaply on eBay and dedicate each one to a single artist. Generalising, he asks, “How does the (almost) free hardware affect the delivery of the (almost) free media?

Picture
I’ll let the name of the idea do the talking: Rorschmap.

Puzzle AnswerCyborgs beat Robots
In the last Things I invited you to guess who would win in a chess match in which humans and computers could team up in any combination.

I recently read of an empirical answer here, which makes the excellent point that there are actually three criteria at work in any team: the chess skill of the computer(s), the chess skill of the human(s), and the friction in the way they work together as a team.

Some may be surprised to learn the most basic observation from the event: that a team of human + computer is much stronger than even an extremely powerful chess-playing computer. As Kasparov puts it: “Human strategic guidance combined with the tactical acuity of a computer was overwhelming.” Humans are useful!

More impressively, the winner of the tournament was a team of two amateur players working with three computers. The lack of friction in their system of working together beat the raw power of chess-playing supercomputers and the strategic brilliance of grandmasters.

This has some serious implications, too. Most simply, since mediocre computers and mediocre humans are more common than highly skilled ones, and since systems can be invented once and then used by all, there is in some general sense much more potential to solve hard problems than we might otherwise have expected in the world.

More extremely, anyone worried about a technological singularity in which we invent AI that is smarter than us (leading to runaway self-improvement of the AI and a very dangerous 4 hours for humanity) can rest assured that human-AI combinations will probably be smarter than pure AI.

Short version: cyborgs are smarter than robots.

Categories
New

Things 106: Best at Chess, Art of Science, Crowdfunding

Tim Link – Competitive Sandwich Making
Last week Clare and I ran a game based on tessellating pieces of cheese to make the best sandwich for the Hide&Seek Sandpit event. You can read about it and see the photos on my project blog, Tower of the Octopus.

Puzzle
In a chess tournament in which anyone can use any means available to them to come up with their moves, who would win? Some possible answers to give an idea of what kind of thing I’m talking about here:

  • A high-ranking chess Grandmaster
  • A really good chess-playing supercomputer
  • A huge team of moderately skilled players with some method of combining their ideas
  • A moderately skilled player with access to a moderately good computer that can run some basic chess calculations

(I had wondered about this in an abstract way before, but recently found out that has actually been done. I’ll relate what happened in that event next week, but you could of course try to Google as well as guess the answer if you wanted).

Video
(Via Phil): Art out of Science:
(Two views of the same thing. If your browser is up to it, you could try watching both videos simultaneously – start the bottom one 20s after the top):

Links
Kickstarter is one of my favourite things on the internet: people with an idea for something get a platform from which to shout about it, and to collect pre-orders or donations from people that like the idea. If there’s enough interest, the project can go ahead, and everybody wins.

So far I’ve helped fund two comics, the Wormworld Saga app (which saw so much success the creator, Daniel Lieske, decided he could give up his day job), and I’m currently backing The Endangered Alphabets Project, which is the kind of thing I like to imagine in a vague way is going on in the world, but I now have the opportunity to facilitate it directly (also, it’s only just on track to hit target, so do go check it out).

You can follow Kickstarter on Twitter, or go to their home page and scroll to the bottom to sign up for the weekly newsletter which highlights the most interesting projects.

IndieGoGo is similar but for reasons I can’t really pin down doesn’t work as well for me.

Crowdfunder is a UK version which I don’t tend to find as inspiring, but would probably be the best one for someone in the UK to create a project with (since Kickstarter requires a US bank account).

Quote
Overheard in the maths common room when I was studying for my PhD at Royal Holloway:

But nobody knows what probability is! Probability is defined in terms of randomness, and randomness is defined in terms of probability!

Answers to Monty Hall and the Two Envelopes
Last week I asked about the Monty Hall problem, which I should have introduced before the Two Envelopes problem I set two weeks ago.

The Monty Hall problem has a nice Wikipedia page, the most helpful part of which is probably the decision tree showing all possible outcomes.

In brief, the answer is that you should switch after Monty shows you an incorrect door, but certain misguided instincts steer most people away from that choice. The Endowment Effect and Loss Aversion mean that regardless of probability, people fear they would regret “giving up” their first choice more than sticking with it if they end up losing.

The more subtle effect is an instinctive (or partially trained?) feeling that the choices of others have no effect on the probabilities of our own choices in these kind of contexts. This is true when the other person has just as much information as you, but that is not the case here – Monty knows where the car is, and uses that information to ensure that he always opens a door with a goat behind it. So he has more information than you, and when you see his choice you gain some information.

Or to give an answer that might go with the grain of instinct for some people, consider this: there is a 2/3 chance that the car is behind one of the doors you don’t pick. Monty shows you that it definitely isn’t behind one of them. So there’s still a 2/3 chance the car is behind the other one, and a 1/3 chance it’s behind the one you first chose.

As for the Two Envelopes, it turns out this is more difficult than I originally remembered. Again, there’s a great Wikipedia page on the subject, which has quite a lot of detail.

As Thomas noted, a key phrase missing from the subtly specious argument for swapping is “Without Loss of Generality” (WLOG), which one must always be careful to check whenever substituting a variable (in this case, the amount in the envelope) with a specific figure (£10 in the example I gave).

Is it true that the reasoning I gave based on having £10 in the envelope truly retains the generality of the problem – would the reasoning also hold for any other amount? In short, no. For example, there could be 1p in the envelope, or any odd number of pence, in which case we would have to conclude that we had the lesser envelope (although this still means you should swap). More dramatically (here we imagine the envelopes contain cheques, and that these cheques are totally reliable), your envelope could theoretically contain over half of all the money in the world, in which case you can be sure the other envelope contains less. More realistically, it could contain more than 1/3 the amount of money you expect the person filling the envelopes to be willing to give away, in which case you would strongly suspect the other envelope to contain the lesser amount.

If you’re interested, do read the full Wikipedia article, and meanwhile, remember to watch out for unjustifiable WLOGs.